Concept project
Pulse
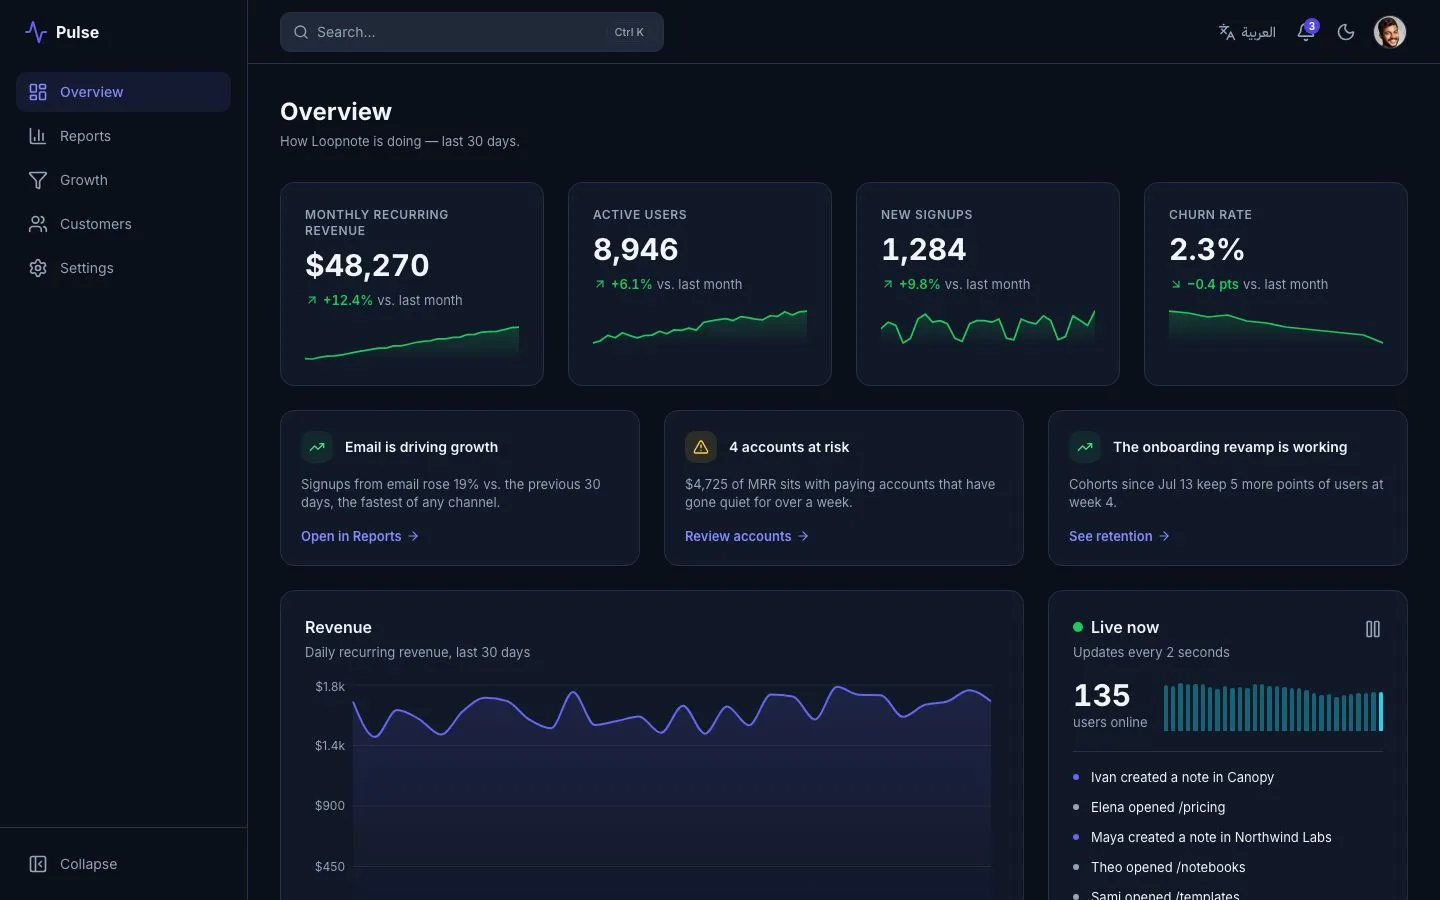
A product analytics dashboard that shows a SaaS team how the business is doing in under ten seconds.
- Websites
- Year
- 2026
- Role
- Design and front-end
- Tools
- React, Vite, Tailwind CSS, React Router, Recharts, Motion
The story
-
01
Problem
Most analytics tools are built for analysts. Founders, product managers and marketers just want to know how the business is doing, fast.
-
02
What I did
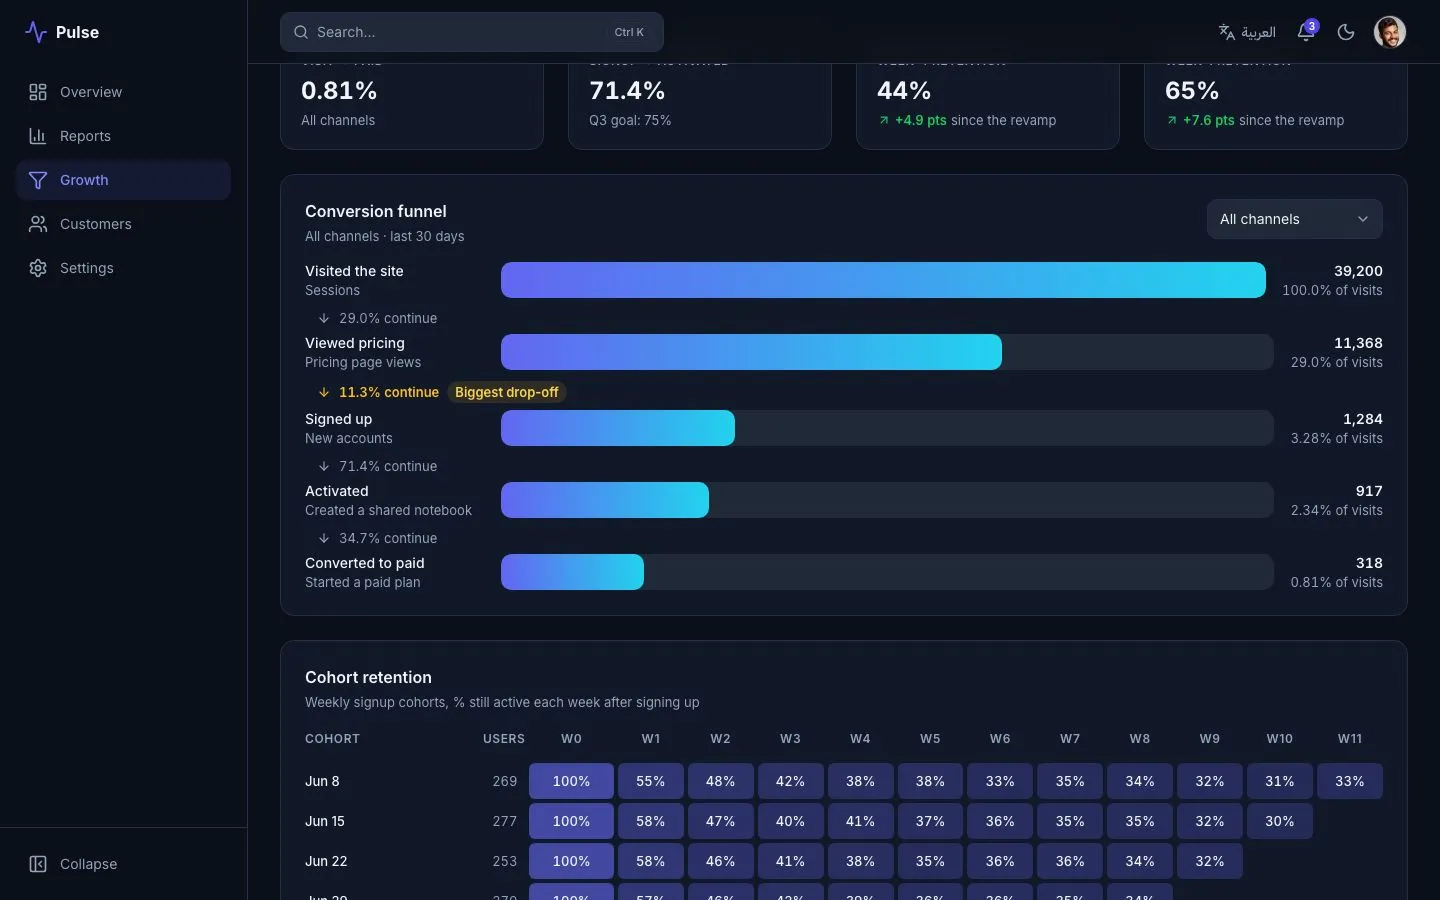
I designed and built the dashboard by hand, with KPI cards, charts, reports, a growth funnel, cohort retention and a customer directory. One seeded data source keeps every number in agreement.
-
03
Result
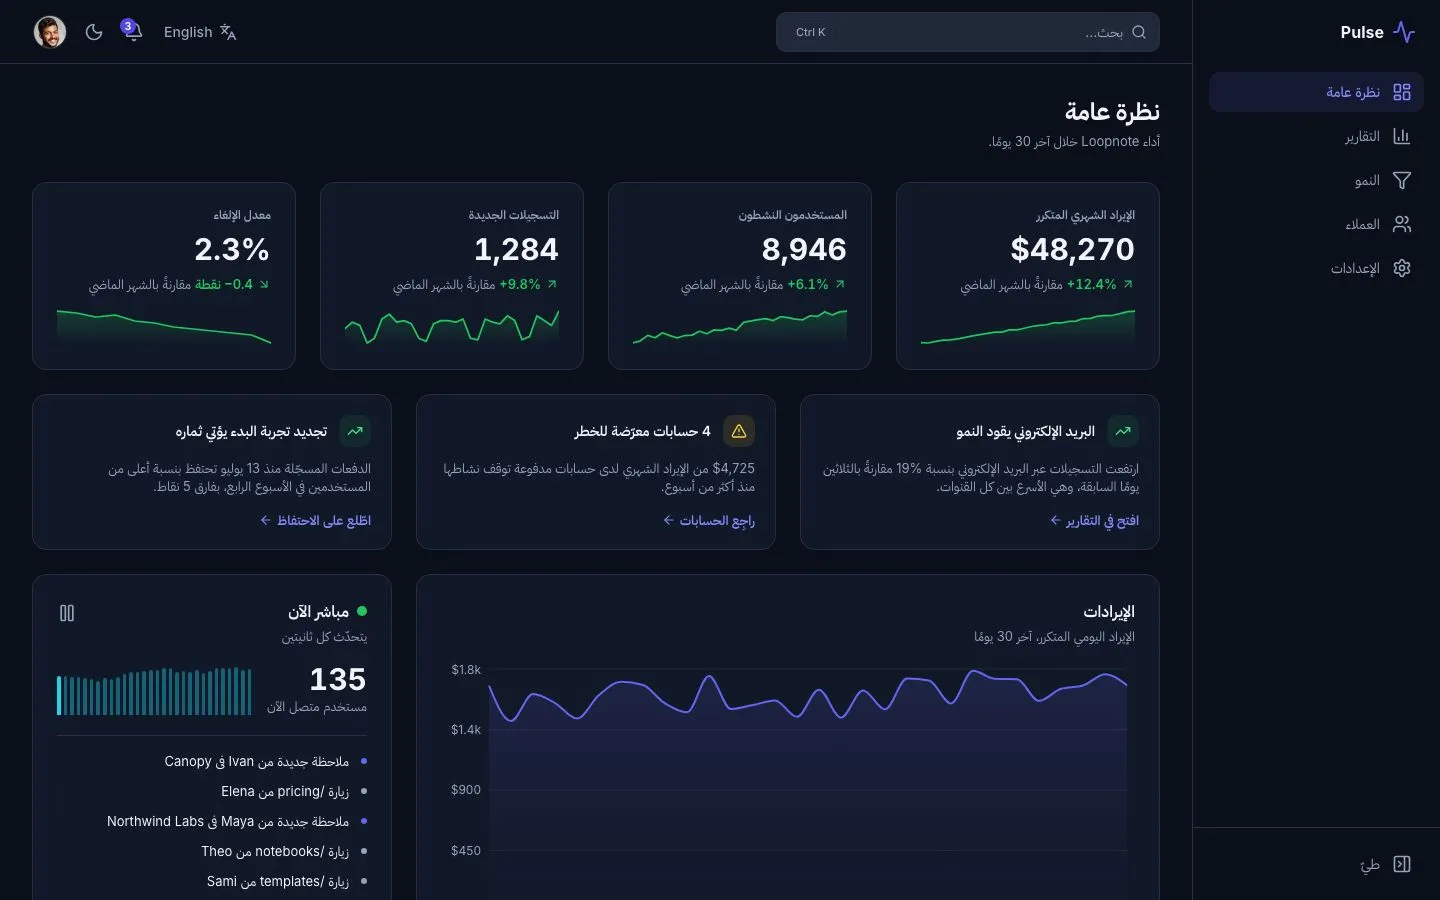
A fast dashboard in English and Arabic, dark and light, that works fully from the keyboard. 160 end-to-end tests and axe checks pass in both themes.
About the project
Pulse is a concept project. The demo shows Loopnote, a made-up note-taking company, through the eyes of its head of product. Everything runs in the browser, and every reload shows the same numbers.
Every color, radius and duration is a design token, so the charts change theme with the rest of the app. The chart library loads only on the pages that need it.
Gallery
Want something like this?
Tell me what you need, and we can plan it together.
Message me on WhatsApp